
More Information
Submitted: August 19, 2026 | Accepted: August 19, 2026 | Published: September 02, 2026
Citation: Razvodovsky YE. Diagnostic Performance of Phosphatidylethanol and Ethyl Glucuronide as Biomarkers of Alcohol Dependence. J Addict Ther Res. 2026; 10(1): 11-14. Available from:
https://dx.doi.org/10.29328/journal.jatr.1001034
DOI: 10.29328/journal.jatr.1001034
Copyright license: © 2026 Razvodovsky YE. This is an open access article distributed under the Creative Commons Attribution License, which permits unrestricted use, distribution, and reproduction in any medium, provided the original work is properly cited.
Keywords: Phosphatidylethanol; Ethyl glucuronide; Cut-off value; Alcohol dependence

Diagnostic Performance of Phosphatidylethanol and Ethyl Glucuronide as Biomarkers of Alcohol Dependence
Razvodovsky YE*
International Academy of Sobriety, Grodno, Belarus
*Corresponding author: Razvodovsky YE, International Academy of Sobriety, Grodno, Belarus, Email: [email protected]; [email protected]
Aims: This study aimed to estimate the concordance between blood Phosphatidylethanol (PEth) and hair Ethyl glucuronide (EtG) in detecting alcohol dependence.
Methodology: The study involved 127 alcohol-dependent men admitted to hospital for detoxification. The concentration of PEth (homologue 16:0/18:1) in blood and EtG in hair was determined by high-performance liquid chromatography - tandem mass spectrometry (LC–MS/MS).
Results: The main result of this study is that blood PEth and hair EtG are highly specific and sensitive markers of alcohol dependence. The correlation between PEth and hair EtG is statistically significant, reflecting shared sensitivity to cumulative alcohol exposure. However, differences in biological incorporation and detection windows limit perfect alignment.
Conclusion: Combined use of both markers may increase the accuracy of the diagnosis and avoid incorrect results caused by biological variables and by analytical errors.
Alcohol dependence is a globally prevalent disorder, which is associated with a high risk of premature death [1]. Early identification of individuals at great risk of developing alcohol dependence represents a serious problem [1]. Traditional biomarkers lack sensitivity and specificity to detect hazardous alcohol consumption [2].
Recent evolution of analytical techniques has provided direct biomarkers that are much more sensitive and specific as compared to the traditional indirect biomarkers [3]. Among these, phosphatidylethanol (PEth) and hair ethyl glucuronide (EtG) are widely used due to their high diagnostic performance and relatively long detection windows [4,5].
PEth has been gaining popularity as a direct intermediate-term biochemical marker to identify chronic alcohol abuse [4]. PEth is a group of abnormal phospholipids that are formed in cell membranes by a transphosphatidylation reaction from phosphatidylcholine only in the presence of ethanol [4]. Recent findings suggest that PEth is superior to the indirect biomarkers [3].
EtG is a minor non-oxidative metabolite of ethanol that can be detected in urine, blood, or hair [5,6]. Hair EtG provides a direct, objective measure of cumulative alcohol intake over weeks to months, independent of self-report bias [7,8].
Research evidence suggests a moderate-to-strong positive correlation between these biomarkers, particularly in populations with regular alcohol abuse [2,3]. However, variability persists due to differences in biological incorporation, temporal resolution, and external influences such as hair treatment [3,7]. Given these differences, understanding the concordance between PEth and EtG is important for interpreting biomarker results. Despite extensive research, sparse data are available regarding diagnostic performance and optimal cut-off levels of PEth in blood and EtG in hair for detecting alcohol dependence.
This study aimed to estimate the concordance between blood PEth and hair EtG in detecting alcohol dependence.
The study involved 127 alcohol-dependent men admitted to hospital for detoxification. The control group consisted of 136 moderately drinking men. PEth concentrations were determined using a validated liquid chromatography–tandem mass spectrometry (LC–MS/MS) method. Whole-blood specimens were subjected to solvent-based extraction following addition of an appropriate stable-isotope-labeled internal standard. Chromatographic separation was performed prior to introduction of the extracts into the mass spectrometer by electrospray ionization. PEth was detected in negative-ion mode using a triple-quadrupole mass spectrometer operated in multiple-reaction-monitoring (MRM) mode. The target PEth molecular species, PEth 16:0/18:1, was identified on the basis of its chromatographic retention time and characteristic precursor-to-product ion transition. Quantification was performed by calculating the ratio of the PEth peak area to that of the internal standard and interpolating this response from a multi-point calibration curve.
Hair EtG was quantified using LC–MS/MS. Hair samples were collected from the posterior vertex region of the scalp, with the proximal end identified to permit segmental analysis. Following standardized washing and drying, the hair was segmented according to the predefined analytical window, finely cut or pulverized, and subjected to solvent extraction. A stable-isotope-labeled EtG internal standard was added before extraction to compensate for variability in sample preparation and mass-spectrometric response. Following extraction, the samples were chromatographically separated and introduced into the mass spectrometer using negative electrospray ionization. EtG was detected using a triple-quadrupole mass spectrometer operated in multiple-reaction-monitoring mode. The deprotonated EtG molecule was selected as the precursor ion and subjected to collision-induced dissociation, with characteristic product ions monitored for quantitative and confirmatory purposes. Quantification was based on the ratio of the EtG peak area to the isotope-labeled internal-standard peak area and was performed using an appropriate multipoint calibration curve. Results were expressed as picograms of EtG per milligram of hair (pg/mg).
Statistical data analysis was performed using Statistica, version 10.0 (StatSoft Inc., Tulsa, OK, USA). Since PEth and EtG values were non-normally distributed, non-parametric tests were used for calculations (Mann-Whitney test, Spearman correlations). Receiver Operating Characteristic (ROC) analysis was performed to assess diagnostic accuracy (sensitivity, specificity, positive predictive value (PPV) and negative predictive value (NPV)).
The median age of alcohol-dependent men was 40.1 years (IQR: 38.8-43.7), while the median age of moderate drinkers was 41.9 years (IQR: 39.1-44.1). There was no statistically significant difference in age between the two groups (p = 0.174). All patients had PEth and EtG values above the upper cut-off for harmful alcohol consumption. The median value of the PEth concentration in the blood of alcohol-dependent men was significantly higher than in the blood of moderate drinkers. The median value of the EtG concentration in hair of alcohol-dependent men was significantly higher than in hair of moderate drinkers (Table 1). Graphical evidence suggests a lack of symmetry in the distribution of PEth and EtG values with a left-hand shift (Figures 1,2).
| Table 1: Values of PEth concentration in the blood (ng/mL) and EtG concentration in hair (pg/mg). | ||
| Parameter | Control | Alcohol dependence |
| PEth | 31.8 (CI: 23.2–86.8) | 2058 (CI: 1433–2830)* |
| EtG | 11.2 (CI: 9.3–61.1) | 317.2 (CI: 75.6–1241)* |
| * – p < 0,05 in comparison to control | ||
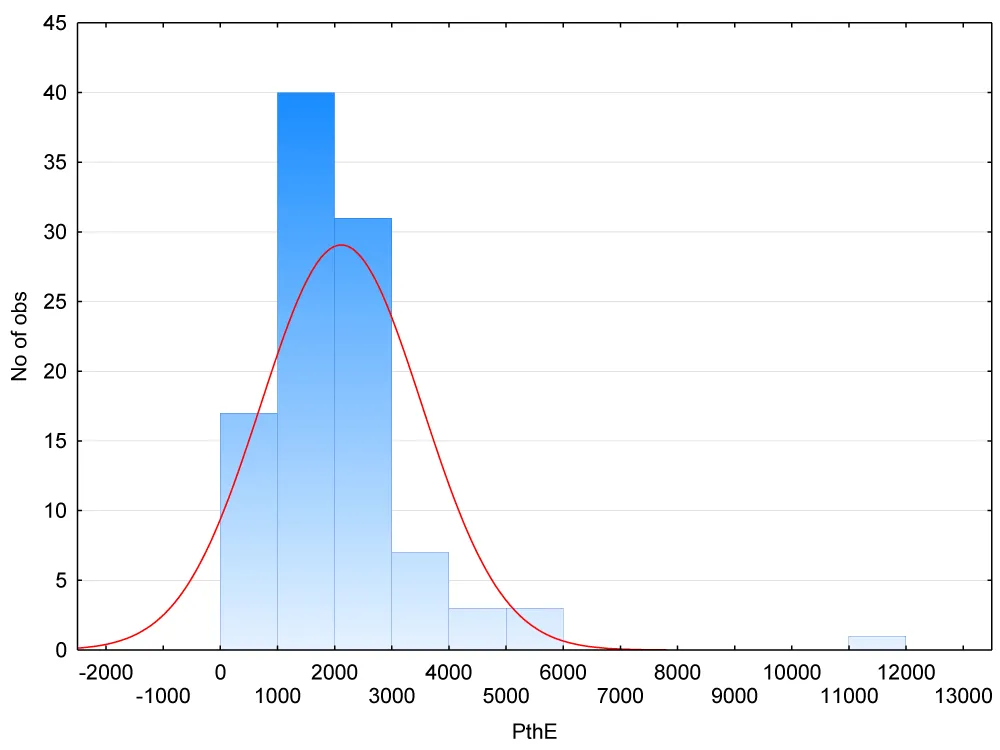
Figure 1: Distribution histogram of the concentration of PEth in blood.
Figure 1: Distribution histogram of the concentration of EtGth in hair.
The optimal cut-off value for PEth was 495 ng/mL. At this cut-off, the model demonstrated strong performance with sensitivity 99%, specificity 96%, PPV 98%, and NPV 98%. The AUROC was 0.99, indicating a very good predictive value of the model. For EtG, a cut-off of 55 pg/mg yielded sensitivity 95%, specificity 96%, positive predictive value 98%, and negative predictive value 90%. The AUROC was 0.99, suggesting a very good predictive value of the model (Table 2). There was a statistically significant correlation between the PEth and EtG values (r = 0.35; p = 0.05). A scatterplot of the individual values of PEth and EtG measured in the same samples is seen in Figure 3.
| Table 2: Results of ROC analysis. | ||
| Parameter | PEth | EtG |
| AUROC [95% CI] | 0,99 [0,99-1,0] | 0,99 [0,98-1,0] |
| cut-off value | 495 ng/mL | 55 pg/mg |
| Sensitivity | 99 % | 95 % |
| Specificity | 96 % | 96 % |
| PPV | 98 % | 98 % |
| NPV | 98 % | 90 % |
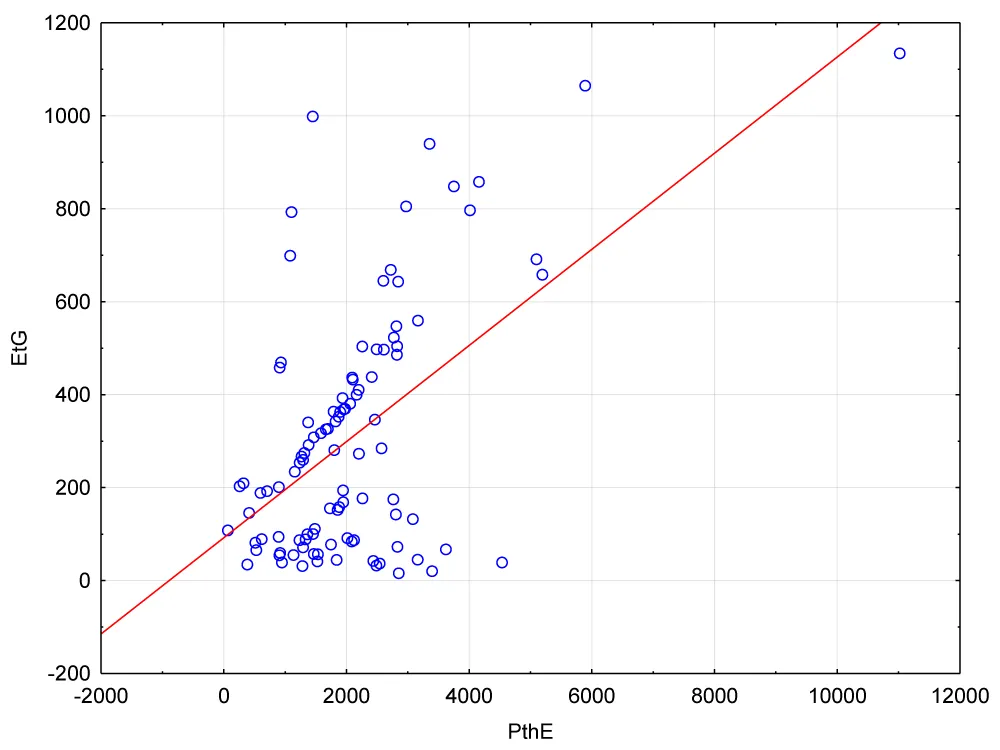
Figure 3: Scatterplot of the individual values of PEth and EtG.
The main result of this study is that blood PEth and hair EtG are highly specific and sensitive markers of alcohol dependence. These findings are in agreement with previously reported results [4,8]. PEth and EtG yield a similar diagnostic performance in detecting alcohol dependence. It should be noted, however, that the analysis suggests a higher sensitivity for PEth compared with EtG.
Available research evidence indicates significant variability of the reference cut-off of PEth concentration for discrimination between different levels of alcohol consumption [8]. It was proposed to use a PEth concentration of 20-200 ng/mL as a cut-off for “significant” alcohol consumption, and a concentration >200 ng/mL as a cut-off for “heavy” alcohol consumption [5]. Another study recommended using a PEth cut-off of 221 ng/L for chronic alcohol abuse [3].
The selection of a PEth cut-off of 495 ng/mL requires careful justification because it is substantially higher than the >200 ng/mL cut-off frequently reported in the literature. Importantly, these two cut-offs should not necessarily be interpreted as competing estimates of the same clinical construct. The commonly used 200 ng/mL cut-off has generally been proposed as an indicator of heavy or chronic alcohol consumption, whereas the 495 ng/mL cut-off identified in the present analysis appears to represent a substantially higher level of alcohol exposure and may therefore be more appropriate for distinguishing individuals with very high and sustained alcohol consumption from those with lower levels of exposure.
Several factors may explain the higher cut-off observed in the present study. First, PEth concentrations are strongly influenced by the intensity, frequency, and recency of alcohol consumption, and concentrations in individuals with established alcohol dependence can considerably exceed conventional clinical decision thresholds [3]. Second, PEth values are affected by inter-individual variability in PEth formation and elimination, as well as by analytical methodology and the specific PEth homolog measured [4].
The difference between 495 ng/mL and 200 ng/mL should therefore be interpreted in the context of the intended diagnostic purpose. A cut-off of >200 ng/mL may provide greater sensitivity for identifying heavy drinking, whereas the higher 495 ng/mL cut-off may improve specificity for identifying individuals with particularly intense and sustained alcohol exposure. Thus, the 495 ng/mL cut-off should not be presented as a replacement for the established 200 ng/mLcut-off. Rather, it represents a population- and outcome-specific threshold derived from the diagnostic objective of the present study.
In the existing literature, several cut-off values have been proposed for EtG concentration in hair to indicate chronic excessive drinking, mainly derived from the studies involving a limited number of individuals [9]. The pooled analysis showed that 30 pg/mg could be a useful cut-off value for EtG in hair to detect an alcohol consumption >60 g/d [10]. The substantially higher cut-off of 55 pg/mg compared with the frequently reported 30 pg/mg cut-off requires particular consideration. The 30 pg/mg value has been widely used as a reference point for identifying chronic excessive alcohol consumption in hair, but it should not be regarded as an invariant diagnostic threshold applicable to all populations and study designs. Differences in the distribution of hair EtG concentrations between study populations, the definition of excessive drinking, the composition of the control group, and the clinical or behavioral endpoint used to derive the cut-off can result in materially different optimal cut-offs.
Importantly, the present study used alcohol dependent individuals as the reference standard. Therefore, the 55 pg/mg cut-off was optimized to distinguish participants meeting this predefined criterion from those who did not. If the control group included moderate rather than completely abstinent drinkers, a higher cut-off would be particularly understandable: moderate drinkers may have measurable hEtG concentrations, and a lower cut-off such as 30 pg/mg could consequently classify a proportion of these participants as positive. Raising the cut-off to 55 pg/mg increases the specificity of hEtG for the more extreme drinking phenotype at the expense of sensitivity for less pronounced alcohol exposure.
The difference between 55 and 30 pg/mg should therefore not be interpreted as evidence that one of the cut-offs is analytically incorrect. Rather, the cut-off may address somewhat different classification problems. A cut-off of approximately 30 pg/mg may be more appropriate when the objective is to identify a broader category of chronic excessive alcohol consumption, whereas the 55 pg/mg cut-off may provide better discrimination when the objective is to identify individuals with a more pronounced and sustained alcohol-use phenotype in the present population.
The study reports a statistically significant positive correlation between PEth concentration and hair EtG levels. This suggests that individuals with higher PEth levels tend to have higher EtG concentrations. However, the correlation is not perfect due to differences in biological processes and timeframes. Although both biomarkers reflect cumulative exposure, EtG integrates alcohol intake over a longer period than PEth [2]. Periods of abstinence or changes in drinking patterns can therefore affect correlation.
Before concluding, several potential limitations of this study should be addressed. In particular, the use of moderately drinking participants as the control group warrants careful consideration. Moderate drinkers cannot be regarded as biologically equivalent to abstinent individuals because repeated alcohol consumption may result in measurable incorporation of EtG into the hair shaft. Consequently, this design evaluates the capacity of hair EtG to discriminate between different levels of alcohol exposure rather than its ability to distinguish alcohol-exposed individuals from genuinely alcohol-negative participants.
This distinction has direct implications for estimates of diagnostic specificity and for the derivation of optimal cut-offs. If moderate drinkers constitute the reference group, individuals with biologically detectable or relatively elevated EtG concentrations may be classified as false-positive controls, thereby potentially reducing the apparent specificity of the biomarker. Conversely, if the study aims specifically to distinguish moderate from excessive or chronic alcohol consumption, moderate drinkers may constitute an appropriate clinically relevant comparator. The suitability of this control group therefore depends critically on the intended diagnostic question.
A further concern is the heterogeneity of the definition of “moderate drinking” across studies. Definitions may differ with respect to quantity, frequency, sex-specific thresholds, assessment period, and the presence of episodic heavy drinking. In addition, classification of moderate drinkers based primarily on self-reported alcohol consumption is susceptible to recall and social-desirability bias [1].
In conclusion, the analysis of blood PEth and hair EtG provides an efficient diagnostic tool to detect alcohol dependence. The correlation between PEth and hair EtG is statistically significant, reflecting shared sensitivity to cumulative alcohol exposure. However, differences in biological incorporation and detection windows limit perfect alignment. Combined use of PEth and EtG decreases the risk of false interpretation and improves the accuracy of the detection of alcohol dependence.
- Babor TF, Casswell S, Graham K, Huckle T, Livingston M, Rehm J, et al. Alcohol: No Ordinary Commodity-a summary of the third edition. Addiction. 2022;117(12):3024–3036. Available from: https://doi.org/10.1111/add.16003
- Andresen-Streichert H, Müller A, Glahn A, Skopp G, Sterneck M. Alcohol biomarkers in clinical and forensic contexts. Dtsch Arztebl Int. 2018;115: 309–315. Available from: https://doi.org/10.3238/arztebl.2018.0309
- Razvodovsky YE. Phosphatidylethanol as a marker of alcohol abuse. International Archive Substance Abuse Rehabilitation. 2022; 4(1):1-5.
- Aradottir S, Asanovska G, Gjerss S, Hansson P, Alling C. Phosphatidylethanol concentrations in blood are correlated to reported alcohol intake in alcohol-dependent patients. Alcohol Alcohol. 2006;41(4):431-7. Available from: https://doi.org/10.1093/alcalc/agl027
- Razvodovsky YE. Ethyl glucuronide as a sensitive marker of alcohol abuse. Int Arch Subst Abuse Rehabil. 2022; 4(15): 1–4.
- Crunelle CL, Yegles M, Nuijs A, Covaci A, De Doncker M, Maudens KE, et al. Hair ethyl glucuronide levels as a marker for alcohol use and abuse: a review of the current state of the art. Drug Alcohol Depend. 2014; 134: 1–11. Available from: https://doi.org/10.1016/j.drugalcdep.2013.10.008
- Boscolo-Berto R, Favretto D, Cecchetto G, Vincenti M, Kronstrand R, Ferrara SD, et al. Sensitivity and specificity of EtG in hair as a marker of chronic excessive drinking: pooled analysis of raw data and meta-analysis of diagnostic accuracy studies. Therapeutic Drug Monitoring. 2014; 36:560–575. Available from: https://doi.org/10.1097/ftd.0000000000000063
- Boscolo-Berto R, Viel G, Montisci M, Terranova C, Favretto D, Ferrara SD. Ethyl glucuronide concentration in hair for detecting heavy drinking and/or abstinence: a meta-analysis. Int J Legal Med. 2013; 127(3): 611–619.
- Schuriberco AV, Razvodovsky YE. Method of estimation of phosphatidylethanol concentration in blood. Academic Journal of Western Siberia. 2022; 18 (4): 36-42.
- Schuriberco AV, Razvodovsky YE. Development and validation of a method for the quantitative determination of ethyl glucuronide in hair. Current problems of alcohol and other chemical addictions: abstracts of reports of the III International Scientific and Practical Conference (October 5, 2023, Grodno). pp. 39–40.