
More Information
Submitted: December 17, 2020 | Approved: December 29, 2020 | Published: December 30, 2020
How to cite this article: Razvodovsky YE. Estimation of the level of alcohol consumption in Russia: A literature review. J Addict Ther Res. 2020; 4: 013-016.
DOI: 10.29328/journal.jatr.1001012
Copyright License: © 2020 Razvodovsky YE. This is an open access article distributed under the Creative Commons Attribution License, which permits unrestricted use, distribution, and reproduction in any medium, provided the original work is properly cited.
Keywords: Alcohol consumption; Methods; Assessment; Russia

Estimation of the level of alcohol consumption in Russia: A literature review
Razvodovsky YE*
Institute Biochemistry of Biologically Active Substances Academy of Science of Belarus, Department of Medico-Biological Problems of Alcoholism, Russia
*Address for Correspondence: Razvodovsky YE, Institute Biochemistry of Biologically Active Substances Academy of Science of Belarus, Department of Medico-Biological Problems of Alcoholism, Russia, Email: [email protected]
Background: the level of alcohol consumption per capita is an important indicator of the alcohol-related problems. However, it is difficult to estimate the real level of alcohol consumption, since part of the consumption comes from illegal sources.
Aim: an overview of studies estimating the overall level of alcohol consumption in Russia.
Methods: in this review, 9 articles were analyzed estimating the overall level of alcohol consumption in Russia.
Results: in the period from 1956 to 2015 the overall level of alcohol consumption was subject to significant fluctuations: it grew almost linearly in the period from 1965 to 1979; decreased markedly in 1981; declined sharply between 1984 and 1987; rose sharply between 1991 and 1994; decreased significantly between 1995 and 1998; then increased significantly in the period from 1999 to 2003, after which it began to decline. The lowest estimate of the level of alcohol consumption for the entire period under consideration was obtained using the method proposed by Razvodovsky (7.25 litres - 1987), and the highest - using the method proposed by Norstrom (19.64 litres - 1994).
Conclusion: despite a significant decrease in the level of alcohol consumption in Russia over the past decade, this level remains high.
The level of alcohol consumption per capita is an important indicator of the alcohol-related problems [1-4]. However, it is difficult to estimate the real level of alcohol consumption, since part of the consumption comes from illegal sources [7-9,13-15]. In Russia, the share of unrecorded alcohol is one of the highest in Europe [14].
Attempts to assess the real level of alcohol consumption in Russia have been made using various methods. Some estimates are made on the basis of surveys of the population. With this approach, there is a large discrepancy in estimates [3,12]. This is due to the fact that the answers of the respondents largely depend on their psychology, the wording of the questions and the setting of the survey [12]. According to the results of an interview conducted within the framework of the RLMS project (The Russian Longitudinal Monitoring Survey), the total level of alcohol consumption in Russia in 1992 was 4.8 litres of pure alcohol per capita [5]. This is below the official level of alcohol sales (excluding illegal consumption), which this year was 5.0 litres per capita. The underestimation of the severity of alcohol-related problems in interviews is a common human feature [12], but in relation to the Russian population, this property is expressed especially sharply due to “facade psychology” and the fear “that something might not work out” [11].
Some experts agree with the opinion that the real level of alcohol consumption in Russia cannot be assessed using self-reports, and that the results obtained from the survey should at least be doubled [12]. According to the results of a study, which was carried out methodologically correctly (almost daily surveys of the same respondents for four months), the average per capita consumption was 16 litres [17].
In relation to this, the estimation of the real level of alcohol consumption using indirect methods is of particular importance. For the first time such an assessment was carried out by Treml, who calculated the total level of alcohol consumption in the USSR since 1960 [16]. In 1980, Goskomstat began assessing the level of consumption of unregistered alcohol in the former Soviet Union [6]. The Goskomstat’s calculations were based on the level of excess sales of sugar as the main raw material for the production of moonshine in Russia at that time. However, in 1988 Goskomstat stopped doing this due to interruptions in the supply of sugar to the distribution network [5].
In 1981, Nemtsov has estimated the real level of alcohol consumption in Russia on the basis of the level of violent mortality recorded by the regional bureaus of forensic medical examination. In this case, the ratio of the number of deaths with alcohol and without alcohol in the blood was used [6]. Later (1988-1989), when the consumption data were declassified, it turned out that the estimates of Treml, Goskomstat, and Nemtsov made independently and using different methodological approaches were very close [9].
Another attempt to dynamically assess the real level of alcohol consumption between 1980 and 2005, based on time series analysis using the ARIMA method using three indirect indicators of alcohol-related problems: mortality from acute alcohol poisoning, mortality from external the causes and incidence of alcoholic psychosis was made by Razvodovsky [14]. It should be noted that the method he proposed, as well as other methods based on time series analysis, has a number of limitations, the most significant of which is the need to know the general level of alcohol consumption at the starting point and the accumulation of estimation errors as the time series lengthens.
In addition, the result of the assessment depends to a certain extent on the degree of influence of non-alcoholic factors on the alcohol variable [12]. The influence of these unaccounted factors was the reason for significant differences in the assessment of the level of consumption based on the use of various alcohol indicators, with the maximum estimate obtained using violent mortality, and the minimum - the incidence of alcohol psychosis. In order to level these methodological limitations, the final score was calculated as the average of the scores obtained using each of the three indicators [12].
Further, the Swedish researcher Norstrom applied the indirect method developed by him, based on the analysis of time series using ARIMA, to estimate the level of alcohol consumption per capita aged 15 years and older in Russia for the period from 1990 to 1998 [11]. The calculation procedure consisted of several stages. First, an assessment was made of the relationship between the dynamics of the level of alcohol consumption and the level of male mortality due to injuries and accidents in the period from 1959 to 1989. For this, the author used the estimates of the level of consumption by Treml (1959-1979) and Nemtsov (1980-1998). At the next stage, using the obtained coefficient, which reflects the relationship between the dependent and independent variables and the dynamics of male mortality from injuries and accidents, the total level of alcohol consumption was calculated for the period from 1990 to 1998 [11].
In a later study, Nemtsov and Shelygin assessed the overall level of alcohol consumption in Russia in the period from 1956 to 2012 using the ARIMA method [10]. The basis for calculating consumption was the estimate of consumption in 1980–1992, which was obtained by averaging estimates from three independent sources: Treml for 1960–1992; Goskomstat for 1980–1989; Nemtsov for 1980–1992. The first stage consisted in constructing an ARIMA model for the average level of alcohol consumption according to the level of standardized mortality rates from alcohol poisoning. The model was built for the period 1980–1992 in order to determine the degree of association between alcohol poisoning and alcohol consumption. At the second stage, on the basis of the mortality rates of men from alcohol poisoning, the resulting model was extrapolated for the period 1956–2012 [10].
The assessments made by Rospotrebnadzor are widely circulating in the media [2]. One of them 18 litres for 2008 is questionable due to the fact that the method has not been published. Moreover, this estimate differs greatly from all other estimates, especially since it is calculated for the entire population. This means that in terms of a population of 15+, it will be even higher. The Rospotrebnadzor assessment was repeated for 2009 and amounted to 15 litres, noting a significant decrease (3 litres) that occurred in just one year. The same results were achieved during the 1985 anti-alcohol campaign over three years with a forced reduction in consumption.
The estimates of overall level of alcohol consumption in Russia are presented in the figure 1. Graphical evidence indicate that in the period from 1956 to 2015 the overall level of alcohol consumption was subject to significant fluctuations: it grew almost linearly in the period from 1965 to 1979; decreased markedly in 1981; declined sharply between 1984 and 1987; rose sharply between 1991 and 1994; decreased significantly between 1995 and 1998; then increased significantly in the period from 1999 to 2003, after which it began to decline. The lowest estimate of the level of alcohol consumption for the entire period under consideration was obtained using the method proposed by Razvodovsky (7.25 litres - 1987), and the highest - using the method proposed by Norstrom (19.64 litres - 1994). Despite a significant decrease in the level of alcohol consumption, noted in Russia over the past decade, this level remains high, which necessitates the implementation of a comprehensive anti-alcohol policy, a key aspect of which is a decrease in the availability of alcohol.
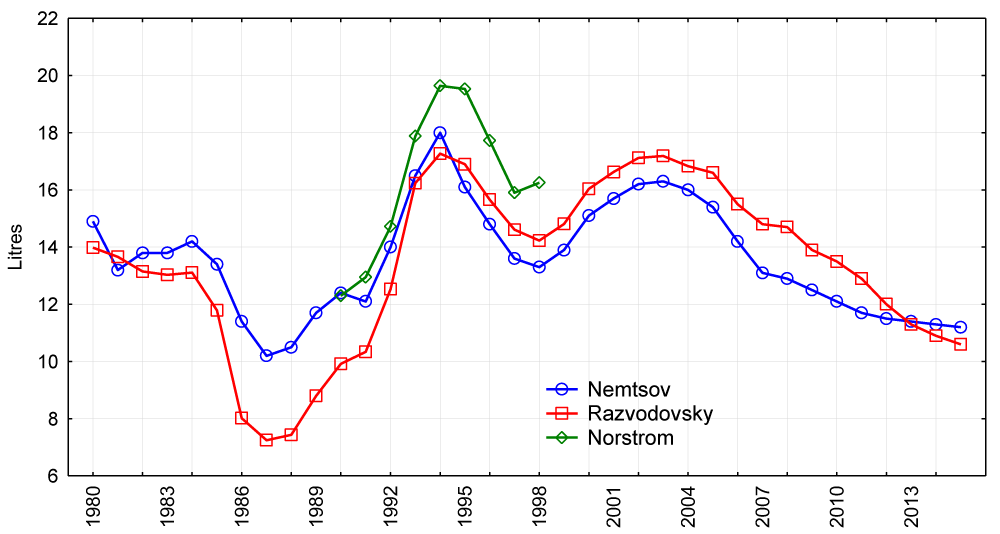
Figure 1: Estimates of overall level of alcohol consumption in Russia between 1980 and 2015.
The discrepancies in expert estimates refer to two periods: 1985-1991 and 2006-2013. Discussion of the reasons for the discrepancy between the estimates of consumption is possible only in the case of published or known methods of obtaining them. The difference in calculation methods most likely lies in two positions - in the initial data and in the mathematical apparatus itself. The discrepancy between the results of Razvodovsky and Nemtsov-Shelygin is most likely due to the fact that Razvodovsky’s assessment was based on the incidence rate of alcoholic psychosis, which reacted to the decline in consumption after 1985 with a sharper decrease than other indicators [13].
It should be emphasized that the correctness of estimating the level of alcohol consumption using indirect methods largely depends on whether alcohol is the only factor that determines the level of the indicator chosen as an indicator of alcohol problems. This is a significant disadvantage of the methods, since factors other than alcohol consumption influence the level of alcohol-related problems. For example, the mortality rate due to acute alcohol poisoning, in addition to the general level of alcohol consumption, is determined by such factors as the pattern of consumption, the toxicity of alcoholic beverages, the availability and quality of drug treatment [15]. It should be noted, however, that if factors other than the level of alcohol consumption influence the level of alcohol-related problems, but their influence is constant over time, then indirect methods of assessment are quite suitable for use [8].
The reliability of indirect estimates of overall alcohol consumption is largely determined by the quality of statistics on alcohol-related problems. The problem of the poor quality of statistical data is especially true for Russia. After analyzing the regional data Nemtsov came to the conclusion that the real mortality rate as a result of acute alcohol poisoning in Russia exceeds the official data by 1.65 times [6]. There is a problem of validity not only of the mortality data, but also of the data on the level of registered alcohol consumption [10]. A significant drawback of indirect assessment methods based on time series analysis using the ARIMA technique is the need to know the level of alcohol consumption at the starting point. Usually, for this purpose, estimates are used, obtained using other methods, in particular data obtained from national screenings [13].
In conclusion, despite a significant decrease in the level of alcohol consumption, noted in Russia over the past decade, this level remains high. In relation to this, the urgent task is the implementation of a comprehensive alcohol policy, a key aspect of which is a decrease in the availability of alcohol. The data presented in this review suggest that indirect estimation methods based on time series analysis, despite a number of limitations, can be used to assess the overall level of alcohol consumption. In the context of the development of a comprehensive alcohol policy, an urgent task is to improve the methods for assessing the overall level of alcohol consumption.
- Bobak M, McKee M, Rose R, Marmot M. Alcohol consumption in a national sample of the Russian population. Addiction. 1999; 94: 857–866. PubMed: https://pubmed.ncbi.nlm.nih.gov/10665075/
- https:rns.online/opinions/V-strane-zapredelnoe-potreblenie-alkogolya-po-sravneniyu-s-tsarskoi-Rossiei-2017-01-24/
- Alanko T. An overview of techniques and problems in the measurement of alcohol consumption. Research Advances in Alcohol and Drug Problems. 1984; 8: 209–226.
- Moskalewicz JR, Razvodovsky YE, Wieczorek L. East-west disparities in alcohol-related harm. Alcoholism and Drug Addiction. 2016; 29: 209– 222.
- Nemtsov A. Alcohol consumption level in Russia: a viewpoint on monitoring health conditions in the Russian federation (RLMS). Addiction. 2003; 369–370. PubMed: https://pubmed.ncbi.nlm.nih.gov/12603237/
- Nemtsov A. Estimates of total alcohol consumption in Russia, 1980-1994. Drug and Alcohol Dependence. 2000; 58: 133–142. PubMed: https://pubmed.ncbi.nlm.nih.gov/10669064/
- Nemtsov AV. Razvodovsky YE. The alcoholic situation in Russia and its reflection in a false mirror. Sobriology. 2015; 3: 70–73.
- Nemtsov AV, Davydov KV, Razvodovsky YE. Comparative analysis of the alcohol situation in Belarus and Russia. Narcology. 2009; 85: 52–61.
- Nemtsov AV, Razvodovsky YE. The alcoholic situation in Russia, 1980–2005. Social and Clinical Psychiatry. 2008; 52-60.
- Nemtsov AV, Shelygin KV. Alcohol consumption in Russia: 1956-2013. Questions of narcology. 2015; 28–32.
- Norstrom T. The role of alcohol in the Russian mortality crisis.Addiction. 2011; 106: 1957–1965. PubMed: https://pubmed.ncbi.nlm.nih.gov/21615584/
- Pernanen K. Validity of survey data on alcohol use. In: Gibbins RJ, et al. eds, Research advances in alcohol and Drug problems. New York. Wiley and Sons. 1974.
- Razvodovsky YE. Unrecorded alcohol consumption: quantitative methods of estimation. Alcoholism. 2010; 46: 15–24.
- Razvodovsky YE. Unreported alcohol consumption in Central and Eastern European countries. Medical News. 2010: 92–96.
- Razvodovsky YE, Nemtsov AV. Alcoholic component of mortality reduction in Russia after 2003. Questions of Narcology. 2016; 3: 63–70.
- Treml VG. Soviet and Russian statistics on alcohol consumption and abuse. In: Premature death in the new independent states (JL Bobadilla, Ch A. Costello F. Mitchell eds.). Wasshcington. 1997; 220–238. PubMed: https://www.ncbi.nlm.nih.gov/books/NBK233387/
- Zaigraev GG. Features of the Russian model of consumption of non-commercial alcohol. Sociological Res. 2002; 33–41.